Atari Paddle Jitter elimination with Auto and Manual Calibration
See how you can eliminate Paddle Jitter by using the full spectrum of your paddle range on your games. Unlike all other adapters on the market, the iCode duo adapters have auto range calibration plus they give you the ability to you fine tune your device to match your specific paddle range based on the specific game you want to play.
This video walks you through all the calibration settings to help you do this quickly.
Configure Retropie on Stella 2014 Retroarch for Atari Paddles
Learn how to configure your Retropie to work perfectly with Atari Paddles to play paddle games like Breakout and Warlords, with perfect precision!
Windows Configuration for Paddles on iCode Atari USB Adapter using Stella Emulator
Learn how to connect 4 original Atari paddles to your PC running Stella Emulator. You will see all configuration steps needed for 4 Paddles. Video walks through configuration needed to play 4 player Warlords with 4 paddles on your PC.
Atari CX-80 Trackball
Configure iCode Duo plus to connect to an Atari Trackball CX-80 for games like missile command
This video shows you how to configure your iCode Duo Plus USB device to use an Atari Trackball to play Missile Command running Atari 8 bit emulation on your PC or other systems.
MiSTer FPGA configuration
MiSTer FPGA with Atari paddles and joysticks using iCode Plus Adapter
Walkthrough on how to setup your iCode Duo Plus USB Adapter to work flawlessly with MiSTer FPGA. The updated firmware even support 2 player paddles with ease. Let me know if you have any questions and check us out at www.icode.com where you get one.
Atari 5200 Controllers
Atari 5200 Controllers on Mac OS with Analog games like Super Breakout & Missile Command on Emulator
This video shows you how to configure your Mac running Atari 8 bit emulation to work with your Atari 5200 controller using the iCode Duo Plus 5200. The videos shows examples of hot to play Missile Command and Super breakout with precision control!
RetroPie
iCode Wireless Bluetooth adapter with Raspberry Pi 4 and RetroPie
Learn how to connect 2 original Atari joysticks wirelessly to your Raspberry pi 4 running Retropie. You will see all configuration steps needed.
Retropie Configuration for iCode USB Adapters
Walkthrough of how to configure iCode usb adapter with Retropie, Retroarch, Stella, and lr-Stella. Video covers Paddles and Joystick configuration.
Atari Driving Controllers
Configure Atari Driving Controllers on Stella emulator
Learn how to configure your iCode USB adapters for Atari Driving Controllers to play multiplayer games like Atari Indy 500. Video shows how to Connect multiple Atari Driving Controllers to a single USB port.
Post navigation
Analog to Digital conversion with RC circuit in microcontroller projects
Analog to Digital conversion with RC circuit in microcontroller projects.
If you were to take the knob or dial off of an electronic device, you might find a potentiometer underneath it. A potentiometer is a variable resistor, and the kind shown below changes resistance as the knob turns. This particular one has a resistance range from 0 ohms to 10,000 ohms.
RC circuit use combination of a resistor (R) and a capacitor (C) to control charge rate of a capacitor. One of the applications of RC circuits is to use a potentiometer as the resistor (R) and this allows you to control how it takes to charge the capacitor (C). The higher the resistance, the longer it takes for the capacitor to charge.
These two components together form an RC (resistor-capacitor) circuit. When the switch is turned on, the capacitor begins to charge. The charge rate always follows the following standard RC charging curve.
The amount of time it takes for charging the capacitor to 63.2% can be calculated using the formula T = R*C in seconds. So for above T = R*C = 100k x 22uF = 2.2 Seconds to get to the 1T line.
TTL circuits on micro controllers typically have a threshold voltage of 1.6V before they recognize an input as HIGH.
So what you can do is connect a digital port to the + side of the capacitor (Vc). Set the port to INPUT mode and force it to LOW. This will discharge the capacitor and immediately the capacitor will begin to charge. Now in a tight loop, just count up from zero and read the PIN till it goas high.
pinMode(pinVC, INPUT);
digitalWrite(A0, LOW); // this will discharge the capacitor
Int i=0; While (! digitalread(PinVC)) { i++; }
The value of i will vary based on how you turn the knob!
To calculate how long it takes for the capacitor to get to a certain voltage you can use the following: t = -ln((Vs-Vc)/Vs)R*C
ln mean natural log or log base e, Vs is the supply voltage, and Vc is the voltage across capacitor
For example, an Atari Paddle uses a 1 Meg ohm resistor. Say we wanted to read the paddles at least 30 times per second using a 5v microcontroller board. What value of capacitor should we use? If you use a 1 Meg Ohm Pot and a 5v board with 1.6 volts being the TTL threshold voltage, a capacitor of 0.068uF, it will take 26.23ms for the pin to go high at the max pot value. – ln((5-1.6)/5)*1000000*0.000000068 = 26.23ms This means you can read it ~38 times per second (1000 / 26.23). Since NTSC frame rate is about 30 frames per second, this will allow you to read it at least once per frame! This is probably why Atari hardware uses a 0.068uF capacitor in its RC circuit
Flashing micro controllers with Arduino IDE or Platform.io are fairly simple when you have the source code of your sketch but there are times where all you have is the HEX file and you need a simple way to program your Pro Micro or other micro controllers quickly.
Both Arduino and Platform.io use a program called AVRDude in the background for flash but figuring our all the parameters and what come ports to use with AVRDude can also get quite complex standalone.
So, I found a much easier way to to use a minimal version of AVRDude and I created a simple command you can run at the command prompt to flash your Pro Micro.
Type PROG followed by your Hex file name and hit enter.
That’s it. You will see something like below and you are DONE!
How it Works
If you are wondering how this works or if you have trouble, here is a step by step details of what the PROG command does. PROG is a batch file PROG.BAT in the same folder that runs a series of commands. In short:
PROG looks for the Pro Micro attached to your PC by searching for a device called “USB Serial Device” to see what COM port it is. If you open up your device manager, you will see something like this. As you can see mine is on COM8.
If it was a Blank one, it would instead say “Arduino Leonardo” and why you need to use PROGB instead as it searches for Arduino Leonardo instead of USB Serial Device.
Now that it knows which COM port the device is on, it resets that port with command: mode COM8: baud=12 > nul
This causes the Pro Micro to go into bootloader mode for about 8 seconds. If you have device manager open, you will see the device change to something like this:
As you can see, it now in boot loader mode and its on COM4.
If for some reason it does not go to bootloader mode, you can manually force the Pro micro into this mode by shorting RST and GND pins for a quick second while its plugged in.
Force Update without Bootloader using PROG
In some cases, the bootloader may not be present and this means we cant reset the device with com ports.
To manually force the update:
Type PROG followed by your Hex file name and hit enter.
Type 0 and hit enter to Skip
It will ask you to reset the device manually. Press Reset/Firmware update button on the device or Short the RST and GND pins and then 1 second later type 1 and press enter. this will list the COM port for the device.
Type the COM port number, press reset again, and press enter.
Force Update without PROG – Command Line Only
When it all fails, you can just directly force the firmware update as follows.
Use this command to find and list all come ports:
wmic path Win32_SerialPort Where “Caption LIKE ‘%%COM%%'” Get Description, DeviceID
Now, Reset the device using the firmware update button or shorting RST and GND pins, and run the command again:
Notice for me COM5 is the new item that showed up so i know the device is on COM5
if your find your port, skip to step 6
Another way to find the port is Go to device manager, manually reset the device with RST/GND or firmware update button, and quickly locate the Ports (COM & LPT) section. you will see it appear there for about 8 seconds. It will then disappear.
Now type the following command replacing the COM5 port with your number and replacing the hex file name with the one you want to flash.
1 Commenton Atari 5200 USB Adapter for your PCPosted in Retro By Ali JaniPosted on
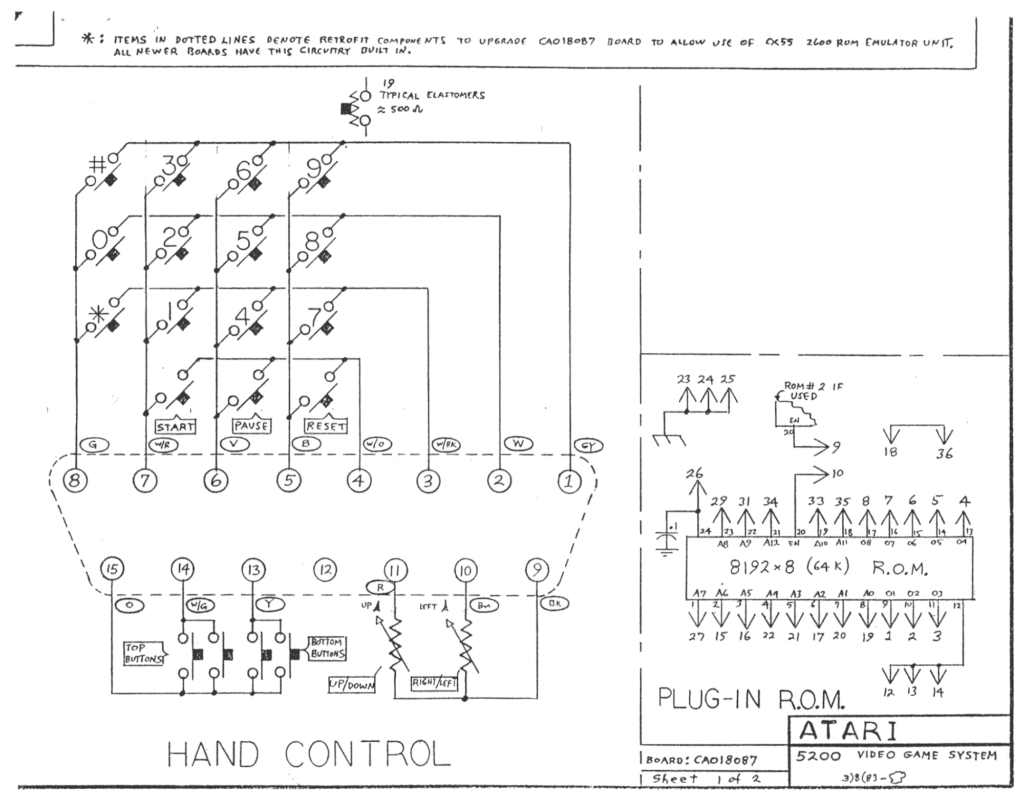
Couple of weeks ago, I received a request on if I could make my retro joystick adapters compatible with Atari 5200 controllers, so I decided to give it a go. So I got myself a controller on eBay for $30 so I can begin the project. I knew right away that i would likely need to design a whole new adapter, given Atari 5200 controllers use 15 pin connectors compared to 9 pin connectors of most of their other consoles.
With some googling, I located the schematic below showing the controller has two potentiometers that control the x and y coordinates and couple of switched for the two fire buttons, and then a 4×4 keypad matrix. So thats total of 12 input lines needed for each joystick. 8 lines for 4×4 matrix, 2 for the stick position, and 2 for the fire buttons. To handle 2 joysticks, I would need at least 24 input ports.
I decided to use a Pro Mirco micro-controller along with a 16 port PCF8575 I/O expander and created the schematic below.
With some modification to my core code I had for the Atari 2600/XT/ST/8Bit Adaper, I was able to get it to work!
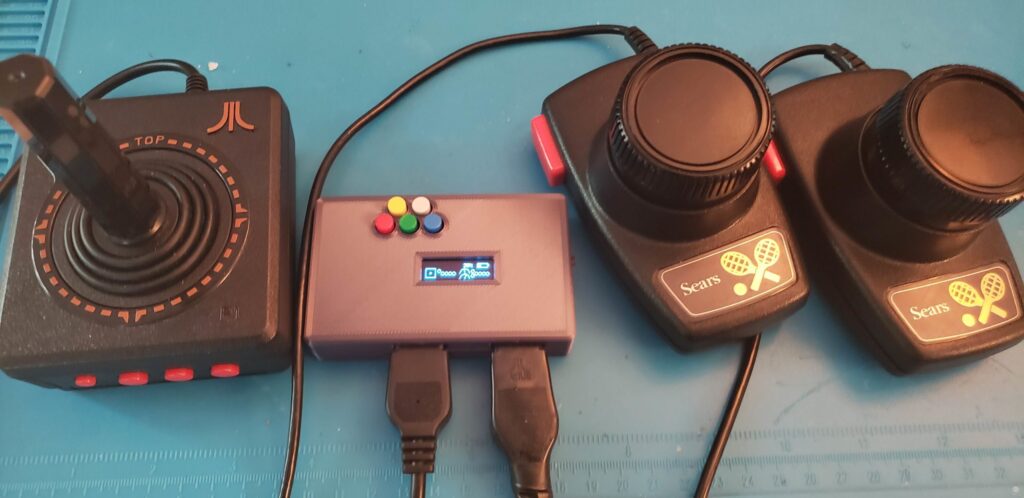
Atari 5200 USB Controller Proof of Concept
For a while I had trouble getting the buttons to work, but with some trouble shooting, I found out the controller I purchased had a bad flex circuit.
Luckily I had a conductive ink pen and it did the magic, at least for my testing. I ordered a new flex circuit for the controller for long term fix but I suspect the ink patch I did will last for several years.
I had 6 ports to spare, so I added common buttons on the unit dor things like Start, Select, etc.. I then designed the PC Board, and cleaned up the code to get it to professional quality, designed and printed a case and success!
Check out my video above to see it in action and give me a thumbs up. If you want to purchase one, you can get them here as well.
In a previous blog article, I showed how you can make 2 and 4 port USB adapters to use with retro Atari Joysitcks. While that was really awesome, I recently made improvements leading to this next generation adapter that I will cover in this article. The top improvements are:
Wireless Bluetooth support
Paddle support in addition to joysticks
Additional buttons you can use without having to open up your joysticks
Here is a video that shows the result if you dont feel like reading.
Many micro-controller projects use lithium ion (li-ion) batteries and we needs a simple way to display the state of charge (SoC) which is how much battery we have left. This is typically displayed on the screen as a partially filled battery icon and optionally a percentage indicator next to it.
There are however several challenges we need to address to be able to display reasonably accurate information on the screen. We will focus on the three primary items below which does the job with very little effort.
How o we measure the battery level?
How does the batteries characteristics taken into account?
How do we quickly draw this visually without having to worry about bitmaps that can be slow and harder to work with?
Measuring Battery Level
Measuring of the battery level can be accomplished by by using one of the micro-controllers input ports set up as an analog to digital converter (ADC). The main thing is to account for max voltage on the input pins compared to your batteries max voltage. For example, most li-ion batteries produce around 4.2 volts when they are fully charged so connecting them to a 3.3 volt operated micro-controller input pin will either burn out the pin or the input will read it the same level so you will not be able to see the difference between 4.2V and 3.3V.
The solution is to use two resistor as voltage dividers to reduce the voltage slightly so the maximum voltage to the pin is 0.75X of the micro-controllers rating. So say we we have a Li-on battery at 4.2V and running a ESP32 micro-controller at 3.3V, we want the maximum voltage to the Analog Input pin to be: 3.3V x 0.75 = 2.5 Volts
Using ohms law and this example calculator, we find out the values we need for the two resistors we need as shown:
So all we need to do is connect our Li-Ion battery to the 2 resistors and feed the divided voltage to the input pin of our micro-controller and we will be within safe specs of the ESP32 and we will get much more accurate readings, especially on the higher end.
For the lower end, we need to know approximately the minimum voltage the micro-controller will still operate before it just gives up and shuts down. Looking at the ESP32s data sheet for operating range it says it can operate with minimum source voltage of 2.3 volts.
At this low end right before they system gives up, what is the voltage applied to our input pin through our divider? Using the same formula above we get 1.37 volts.
So what will the ESP 32 input pin measure when it sees 2.5V on the high end and 1.37V on the low end? This can vary depending on how many bits the ADC of the micro-controller has. The ESP32 has 12-bit ADCs which means it can report 4096 different levels on the ADC pin. If you assume 4096 = 3.3V and 0 is 0V, this means our range of 1.37 to 2.5v should give us values between 1700 and 3100. In practice, its not 1:1 like this as the ADC performs differently in higher and lower ends and amount of load on battery can effect it, so you may need to measure the full charge level for your project. For now we can use these and I will show you how to adjust for load later in the article. This brings the next challenge as follows.
Li-ion batteries do not discharge linearly!
We need to understand how a Li-Ion batteries discharge over time because if we simply take the voltage we measure and show it as a percentage between low and high range, we will not get correct results because the discharge curve for Li-Ion batteries are not linear. Instead the they typically look something like below.
Between full charge (V full) say 4.2V and (V exp) ~3.3v, the discharge rate is rapid. For majority of the operating time, the discharge rate is very low. this is the mid section of the graph above. The higher the battery capacity, the longer this middle cycle is. Finally, when the voltage reaches (Vnom), the discharge rate picks up quickly. If we do not account for this you will see some ugly results on your display.
For example, lets say you have a 500mah battery that lasts about 4 hours in your project and our battery reading range was 3100 at full and 1700 right before it would shut down as described previously:
First 30 minutes you would see the battery go down from 100% to 80% (readings of 3100 to 2820 )
Next 3 hours you would see it go from 80% to 60% (reading of 2820 to 2540)
Then, you would see it drop from from 60% to 0 in last 30 minutes! (reading of 2540 to 1700)
How did I go from 60% to 0 so fast? Sounds familiar
We can give users a much better experience and account for this in our project by treating each of these 3 phases differently. We can normalize these phases by
Mapping the first phase which was originally 100 to 80%, to be instead 100 to 90%.
Mapping the second phase which was originally 80 to 60%, to be instead 90%-10%.
Mapping the last phase which was originally 60 to 0%, to be instead 10%-0%.
This is how it would look like in code:
    value = analogRead(GPIO_NUM_36);

    if (value >= 3100) bat_percent = 100;
    else if (value >= 2820)    // 90-100% range
      bat_percent = map(value, 2820, 3100, 90, 100);
    else if (value >= 2540)    // 10-90% range
      bat_percent = map(value, 2540, 2820, 10, 90);
    else if (value >= 1700)    // 0-10% range
      bat_percent = map(value, 1700, 2540, 0, 10);
    else bat_percent = 0;
So I tested this in a test project where I used a small screen with an ESP32 connected to a 500mah Li-Ion battery.
Remember I mentioned earlier that load of projects can effect the range I used above which was 3100-1700. So I fully charged the battery and connected to the ESP32 to capture battery levels and saw the high was almost 2700 and they lows before my battery died was 1700 . I decided to graph my batteries discharge curve by checking voltage every second and sending the values via Bluetooth communication to my PC where I could graph the discharge curve using raw levels and the mapped percentages based on adjustments I made. Here are the results:
You can see the true discharge curve in blue and how the modified code below transformed it to the orange much linear percentage over time.
    value = analogRead(GPIO_NUM_36);

    if (value >= 2650) bat_percent = 100;
    else if (value >= 2500)    // 85-100% range
      bat_percent = map(value, 2500, 2650, 85, 100);
    else if (value >= 2100)    // 10-85% range
      bat_percent = map(value, 2100, 2500, 10, 85);
    else if (value >= 1700)    // 0-10% range
      bat_percent = map(value, 1700, 2100, 0, 10);
    else bat_percent = 0;
Drawing the Battery Indicator
Instead of messing with loading bitmaps which can we a bid difficult to deal with, I found it much easier to just draw 3 of rectangles as follows:
You can then easily update the last filled rectangle with the current percentage adjusted for size of the rectangle. For example if the rectangle is 20 in width, you would just divide your battery percentage by 5 to get the width of the filled rectangle. This is what it looks like on my sample project. You can tell I missed the thickness of my first rectangle
Good luck and make sure to leave comments and questions!
I recently built a Raspberry Pi 4 unit with Retro Pi and Emulation Station to check out its performance for retro gaming and when I got the Atari 800 emulation to work, it brought back many childhood memories of my first real PC. Games like Star Raiders and M.U.L.E. were well ahead of their time and to get the true experience, they have to be played with real Atari joysticks!
Star Raiders and M.U.L.E. on Atari 800
For past few months, I spent a good amount of time programming micro-controllers for IoT devices for my work projects and I thought about the possibility of using a micro-controllers to adapt Atari Joysticks to a PC so they can be seen as regular PC Gamepads.
I looked online and found some classic joysticks that came with the Atari Game Console Flashback unit for $15 on eBay and decided to give it a shot.
I checked out the Pin Diagrams for the joysticks and it seemed simple enough as they are basically 5 switches (1 for each direction and 1 fire button). Since I wanted at least 2 Joysticks connected for multiplayer games, I needed at least 10 IO ports to connect the 5 switches of each joystick.
I decided to use an Arduino Pro Micro controller since it was only $4, had plenty of IO ports, and most importantly it had a USB port that can communicate with PCs as a HID device.
Back
I created a circuit design on EasyEDA so I could later order a PC baord but initially I created a prototype using PCS Prototype Boards you can get from Amazon or Aliexpress for pennies.
I ordered a few DB9 male connectors where the I could plug the joysticks into and put the parts on the board and soldered the connections.
Front
I wrote some code in Arduino and after several attempts and figuring out custom board files for naming, finally had success. You can get the Dual joystick code from here.
If you are wondering how the animation below shows 5 button working, its not related to directions.. keep reading as there are multi button Atari joysticks.
Next. I decided to make an enclosure for it using my 3D printer! I drew it up in Fusion 360 and printed the top and bottom and made quite a tight fit.
3D printed case and top
I was finished with first working prototype. Next I refined it to a smaller version with a professionally made circuit board so its more reliable, no jumper wires, and less soldering. So its basically done.
Fusion 360 Design
Download STL files here.
But wait, M.U.L.E. is best with 4 players and I had to find a way to get it done so I could play with my nephews. One way was just to build another one taking up 2 USB ports and double the parts, and another was to challenge myself to do a 4 player design with a single USB port. So I did both
For the 4 port unit, I needed more ports so I decided to use a I2C I/O extender that can extend 2 GPIO pins to 16 using serial communication. I also wanted to support the modified Joysticks that have the extra Start, Select, Menu, and a few more button. Here is the circuit diagram and the outcome.
It worked great and I can tell you we had an amazing time playing 4 player M.U.L.E. ! So give it a shot and make one. You can get the code here.
If you rather just buy one from me, you can get it below. All net proceeds go to charity.
Using JavaScript to locate controls in ASP.net pages that are linked to master pages can be tricky. This is because the ASP.net reassigns control IDs dynamically and the names change.
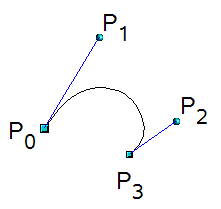
At t=0 you will be at p0, and at t=1 you will be at p3.
The function below is a C# implementation of the formula return the X and Y coordinates of a position on the curve for a given Time (t) and the 4 points that define the Bezier Curve.
You can easily extend this to connect multiple curves to each other (multi-segmented path). You can do this simply by making p0 of subsequent segments equal p3 of the prior segment.
Include this function in your c# projects to create smooth curves.
To use the function, simply pass in the 4 point and a time (between 0 and 1). To draw the curve, try calling this function from a for loop that looks something like this:
// preset your p0,p1,p2,p3

Vector2 PlotPoint;
for (float t = 0;  t <= 1.0f; t += 0.01f)
{
   PlotPoint = GetPoint(t, p0, p1, p2, p3);

   // now call some function to plot the PlotPoint
   YourDrawFunction(PlotPoint);
}
This basically starts you at p0 when time t is zero and at each increment of time +0.01 you will slowly move on the curve towards p3.
So to give you an idea of how this was used by my son in one of his games, watch the video below
Note these are circular Paths each withe 3 segments. Each segment is a 4 point Bezier calculation.
p3 of the each segment is common to p0 of next each segment.
To make the circular, p3 of last segment must be same as p0 of 1st segment.
p2 and p3 of each segment must be on a strait line with p0 and p1 or the next segment. (this give you the double handles for each point)
So this means:
If a path point was moved by user, you must also move left and right control handler points by same deltas
If left handler moved, must also move corresponding path point so it intersects line to other handler at mid point
If right handler moved, must also move corresponding path point so it intersects line to other handler at mid point